每当发现系统变慢,我们通常会执行top或uptime来了解系统的负载情况
1
2
[root@ceph0 ~]# uptime 09:17:59 up 4 days, 10:39, 1 user, load average: 2.41, 2.64, 2.58
上面的值分别表示
1
2
3
4
09:17:59 系统当前时间 up 4 days, 10:39, 系统运行的时间 1 user 正在登陆的用户数量 load average: 2.41, 2.64, 2.58 一分钟 5分钟 15分钟的平均负载值
平均负载 load average 平均负载 ,这个词可能对于很多人来说是既熟悉又陌生的,什么是平均负载呢? 我相信很多人可能会理解成这里的 load average: 2.41, 2.64, 2.58 是CPU的平均利用率,其实不是这样的。
你可以执行 man uptime 查看 uptime 的手册。其中DESCRIPTION 中就说明了 uptime 的作用
1
2
3
4
5
6
7
8
DESCRIPTION uptime gives a one line display of the following information. The current time, how long the system has been running, how many users are currently logged on, and the system load averages for the past 1, 5, and 15 minutes. This is the same information contained in the header line displayed by w(1). System load averages is the average number of processes that are either in a runnable or uninterruptable state. A process in a runnable state is either using the CPU or waiting to use the CPU. A process in uninterruptable state is waiting for some I/O access, eg waiting for disk. The averages are taken over the three time intervals. Load averages are not normalized for the number of CPUs in a system, so a load average of 1 means a single CPU system is loaded all the time while on a 4 CPU system it means it was idle 75% of the time.
简单来说,平均负载是指单位时间内,系统处于可运行状态 和不可中断状态 的平均进程数,也就是平均活跃进程数
所谓可运行状态的进程,是指正在使用CPU或者正在等待CPU的进程,也就是我们常用ps命令看到的,处于R状态(Running 或Runnable)的进程。
不可中断状态的进程则是正处于内核态关键流程中的进程,并且这些流程是不可打断的,比如最常见的是等待硬件设备的I/O响应,也就是我们在ps命令中看到的D状态(UninterruptibleSleep,也称为Disk Sleep)的进程。
比如,当一个进程向磁盘读写数据时,为了保证数据的一致性,在得到磁盘回复前,它是不能被其他进程或者中断打断的,这个时候的进程就处于不可中断状态。如果此时的进程被打断了,就容易出现磁盘数据与进程数据不一致的问题。
所以,不可中断状态实际,上是系统对进程和硬件设备的一种保护机制。
因此,你可以简单理解为,平均负载其实就是平均活跃进程数。平均活跃进程数,直观上的理解就是单位时间内的活跃进程数,但它实际上是活跃进程数的指数衰减平均值。这个“指数衰减平均”的详细含义你不用计较,这只是系统的一种更快速的计算方式,你把它直接当成活跃进程数的平均值也没问题。
既然平均的是活跃进程数,那么最理想的,就是每个 CPU 上都刚好运行着一个进程,这样每个CPU 都得到了充分利用。比如当平均负载为 2 时,意味着什么呢?
在只有 2 个 CPU 的系统上,意味着所有的 CPU 都刚好被完全占用。
在 4 个 CPU 的系统上,意味着 CPU 有 50% 的空闲。
而在只有 1 个 CPU 的系统中,则意味着有一半的进程竞争不到 CPU。
平均负载多少为合理 平均负载最理想的情况是等于 CPU 个数。所以在评判平均负载时,首先你要知道系统有几个 CPU,这可以通过 top 命令或者从文件 /proc/cpuinfo 中读取,比如:
1
2
[root@ceph0 ~]# cat /proc/cpuinfo|grep 'model name'|wc -l 16
有了 CPU 个数,我们就可以判断出,当平均负载比 CPU 个数还大的时候,系统已经出现了过载。
我们看到 load average: 2.41, 2.64, 2.58 有三个值,到底该看哪一个呢?其实都要看,三个不同时间间隔的平均值,其实给我们提供了,分析系统负载趋势的数据来源,让我们能更全面、更立体地理解目前的负载状况。
打个比方,就像初秋时北京的天气,如果只看中午的温度,你可能以为还在 7 月份的大夏天呢。但如果你结合了早上、中午、晚上三个时间点的温度来看,基本就可以全方位了解这一天的天气情况了。
同样的,前面说到的 CPU 的三个负载时间段也是这个道理。
如果 1 分钟、5 分钟、15 分钟的三个值基本相同,或者相差不大,那就说明系统负载很平稳。
但如果 1 分钟的值远小于 15 分钟的值,就说明系统最近 1 分钟的负载在减少,而过去 15 分钟内却有很大的负载。
反过来,如果 1 分钟的值远大于 15 分钟的值,就说明最近 1 分钟的负载在增加,这种增加有可能只是临时性的,也有可能还会持续增加下去,所以就需要持续观察。一旦 1 分钟的平均负载接近或超过了 CPU 的个数,就意味着系统正在发生过载的问题,这时就得分析调查是哪里导致的问题,并要想办法优化了。
假设我们在一个单 CPU 系统上看到平均负载为 1.73,0.60,7.98,那么说明在过去 1 分钟内,系统有 73% 的超载,而在 15 分钟内,有 698 % 的超载,从整体趋势来看,系统的负载在降低。
平均负载多高,需要重点关注 当平均负载高于 CPU 数量 70% 的时候,你就应该分析排查负载高的问题了。一旦负载过高,就可能导致进程响应变慢,进而影响服务的正常功能。
但 70% 这个数字并不是绝对的,最推荐的方法,还是把系统的平均负载监控起来,然后根据更多的历史数据,判断负载的变化趋势。当发现负载有明显升高趋势时,比如说负载翻倍了,你再去做分析和调查。
平均负载与 CPU 使用率 现实工作中,我们经常容易把平均负载和 CPU 使用率混淆,所以在这里,我也做一个区分。
可能你会疑惑,既然平均负载代表的是活跃进程数,那平均负载高了,不就意味着 CPU 使用率高吗?
我们还是要回到平均负载的含义上来,平均负载是指单位时间内,处于可运行状态和不可中断状态的进程数。所以,它不仅包括了正在使用 CPU 的进程,还包括等待 CPU 和等待 I/O 的进程。
而 CPU 使用率,是单位时间内 CPU 繁忙情况的统计,跟平均负载并不一定完全对应。比如:
CPU 密集型进程,使用大量 CPU 会导致平均负载升高,此时这两者是一致的。
I/O 密集型进程,等待 I/O 也会导致平均负载升高,但 CPU 使用率不一定很高。
大量等待 CPU 的进程调度也会导致平均负载升高,此时的 CPU 使用率也会比较高。
案例分析 下面,我们以三个示例分别来看这三种情况,并用 iostat、mpstat、pidstat 等工具,找出平均负载升高的根源。
1 root@linux:~# apt install stress sysstat
stress 是一个Linux 系统压测工具,可以用作异常进程模拟平均负载升高。
sysstat 包含了常用的Linux 性能工具,用来监控和分析系统性能,这里我们会用到 mpstat 和pidstat
mpstat 是一个常用的多核 CPU 性能分析工具,用来实时查看每个CPU 的性能指标,以及所有 CPU 的平均指标。
pidstat 是一个常用的进程性能分析工具,用来实时查看进程 CPU、内存、I/O 以及上下文切换的性能指标。
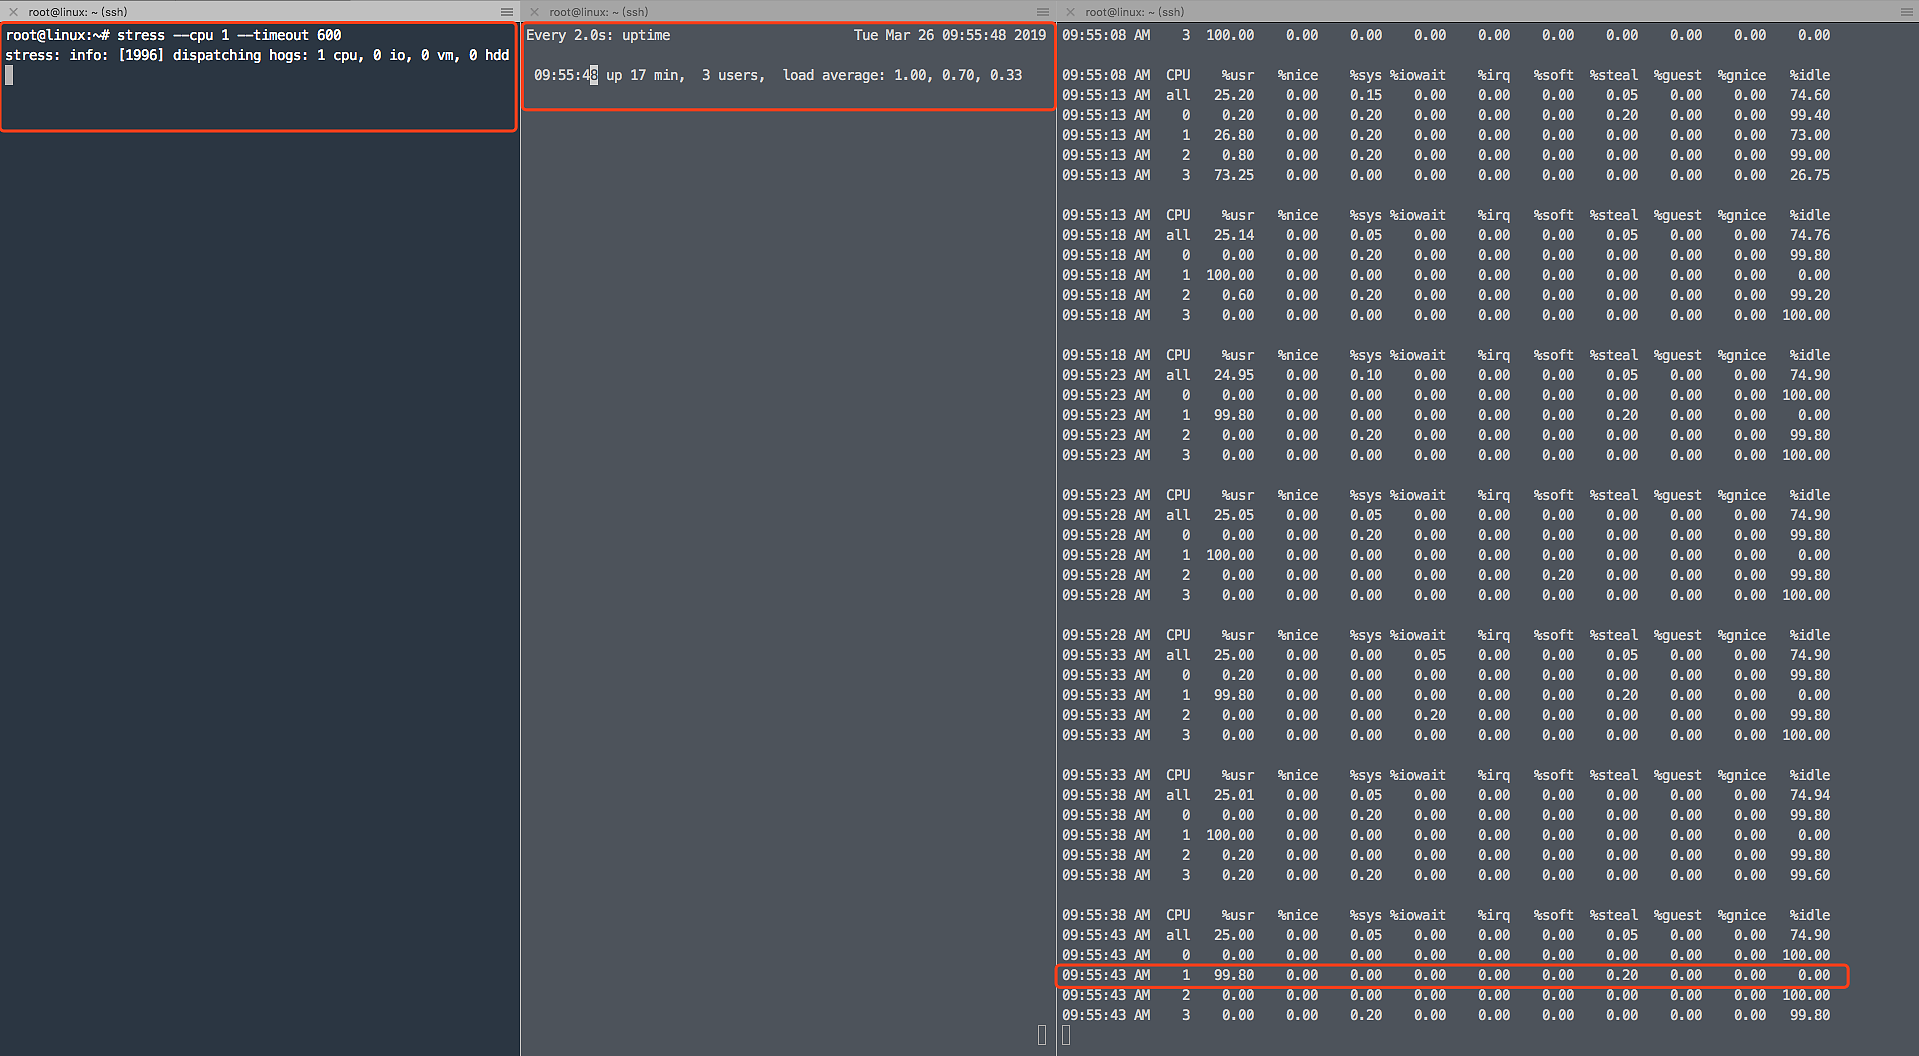
场景一, CPU密集型进程 分别开三个终端
1.模拟 CPU 100%
1 root@linux:~# stress --cpu 1 --timeout 600
2.查看平均负载变化 -d 参数表示高亮显示变化的区域
3.在第三个终端运行 mpstat 查看 CPU 使用率的变化情况: -P ALL 表示监控所有 CPU,后面数字 5 表示间隔 5 秒后输出一组数据
1
2
3
4
5
6
10:02:45 AM CPU %usr %nice %sys %iowait %irq %soft %steal %guest %gnice %idle 10:02:50 AM all 24.99 0.00 0.05 0.00 0.00 0.00 0.05 0.00 0.00 74.91 10:02:50 AM 0 0.20 0.00 0.20 0.00 0.00 0.00 0.00 0.00 0.00 99.60 10:02:50 AM 1 0.00 0.00 0.00 0.00 0.00 0.00 0.00 0.00 0.00 100.00 10:02:50 AM 2 0.00 0.00 0.00 0.00 0.00 0.00 0.00 0.00 0.00 100.00 10:02:50 AM 3 99.80 0.00 0.00 0.00 0.00 0.00 0.20 0.00 0.00 0.00
从终端二中可以看到,1 分钟的平均负载会慢慢增加到 1 ,而从终端三中还可以看到,有一个 CPU 的使用率达到 99.8% ,但是它的 iowait 只用 0 ,这说明,平均负载的升高正是由于 CPU 使用率增加造成的。
那么,到底是哪个进程导致了 CPU 使用率为 100% 呢?你可以使用 pidstat 来查询:
1
2
3
4
5
6
7
8
9
10
root@linux:~# pidstat -u 5 1 Linux 4.4.0-21-generic (linux) 03/26/2019 _x86_64_ (4 CPU) 10:03:31 AM UID PID %usr %system %guest %CPU CPU Command 10:03:36 AM 0 2873 0.00 0.20 0.00 0.20 2 watch 10:03:36 AM 0 2878 100.00 0.00 0.00 100.00 3 stress Average: UID PID %usr %system %guest %CPU CPU Command Average: 0 2873 0.00 0.20 0.00 0.20 - watch Average: 0 2878 100.00 0.00 0.00 100.00 - stress
从图中可以看出 是stress 导致的 CPU 占用 100%
场景二 I/O 密集型 首先是运行 stress-ng 命令,这次模拟 I/O 压力,即不停地执行 sync:
为什么使用 stress-ng ,而不使用 stress 呢?
我们在执行 stress –cpu 1 –timeout 600 时会发现:iowait无法升高,但是 %system 的使用率非常高问题。
这是因为案例中stress使用的是 sync() 系统调用,它的作用是刷新缓冲区内存到磁盘中。我这里的机器是新安装的虚拟机,缓冲区可能比较小,无法产生大的 IO 压力,这样大部分就都是系统调用的消耗了。
解决方法是使用stress的下一代stress-ng,它支持更丰富的选项,比如 stress-ng -i 1 –hdd 1 –timeout 600(–hdd表示读写临时文件)。
1
2
3
root@linux:~# stress-ng -i 1 --hdd 1 --timeout 600 stress-ng: info: [7084] dispatching hogs: 1 hdd, 1 iosync stress-ng: info: [7084] cache allocate: default cache size: 16384K
然后观察 uptime
1 10:49:52 up 1:11, 6 users, load average: 5.20, 5.05, 2.57
观察mpstat
1
2
3
4
5
6
7
# mpstat -P ALL 5 10 Average: CPU %usr %nice %sys %iowait %irq %soft %steal %guest %gnice %idle Average: all 0.07 0.00 3.03 47.74 0.00 0.01 0.04 0.00 0.00 49.12 Average: 0 0.06 0.00 0.54 21.93 0.00 0.00 0.00 0.00 0.00 77.47 Average: 1 0.12 0.00 0.54 9.15 0.00 0.00 0.02 0.00 0.00 90.17 Average: 2 0.02 0.00 0.97 74.55 0.00 0.00 0.02 0.00 0.00 24.45 Average: 3 0.06 0.00 10.11 85.68 0.00 0.00 0.10 0.00 0.00 4.05
发现 1分钟负载增加到5.20 时 有一个 CPU 使用率 升高到了10.11 而iowait 则达到了 85.68 。
可以看到是 stress-ng-hdd 这个进程导致的。
1
2
3
4
5
6
7
8
9
10
11
12
13
14
15
16
17
18
19
20
root@linux:~# pidstat -u 5 1 Linux 4.4.0-21-generic (linux) 03/26/2019 _x86_64_ (4 CPU) 10:51:52 AM UID PID %usr %system %guest %CPU CPU Command 10:51:57 AM 0 7 0.00 0.20 0.00 0.20 0 rcu_sched 10:51:57 AM 0 240 0.00 0.20 0.00 0.20 2 jbd2/vda1-8 10:51:57 AM 0 268 0.00 0.20 0.00 0.20 1 systemd-journal 10:51:57 AM 0 615 0.00 0.20 0.00 0.20 1 qemu-ga 10:51:57 AM 0 5417 0.20 0.20 0.00 0.40 0 watch 10:51:57 AM 0 7085 0.20 10.00 0.00 10.20 3 stress-ng-hdd 10:51:57 AM 0 7087 0.00 2.00 0.00 2.00 2 kworker/u128:3 Average: UID PID %usr %system %guest %CPU CPU Command Average: 0 7 0.00 0.20 0.00 0.20 - rcu_sched Average: 0 240 0.00 0.20 0.00 0.20 - jbd2/vda1-8 Average: 0 268 0.00 0.20 0.00 0.20 - systemd-journal Average: 0 615 0.00 0.20 0.00 0.20 - qemu-ga Average: 0 5417 0.20 0.20 0.00 0.40 - watch Average: 0 7085 0.20 10.00 0.00 10.20 - stress-ng-hdd Average: 0 7087 0.00 2.00 0.00 2.00 - kworker/u128:3
场景三 大量进程的场景 当系统中运行进程超出 CPU 运行能力时,就会出现等待 CPU 的进程。
模拟32个进程
1
2
root@linux:~# stress -c 32 --timeout 600 stress: info: [7573] dispatching hogs: 16 cpu, 0 io, 0 vm, 0 hdd
由于系统只有 16 个CPU,明显比 32 个进程要少得多,因而,系统的 CPU 处于严重过载状态,平均负载高达25.16
1 14:02:27 up 4:24, 3 users, load average: 25.16, 8.53, 3.08
查看pid
1
2
3
4
5
6
7
8
9
10
11
12
13
14
15
16
17
18
19
20
21
22
root@linux:~# pidstat -u 5 1 Linux 4.4.0-21-generic (linux) 03/26/2019 _x86_64_ (4 CPU) 11:12:50 AM UID PID %usr %system %guest %CPU CPU Command 11:12:55 AM 0 8255 49.90 0.00 0.00 49.90 0 stress 11:12:55 AM 0 8256 49.90 0.00 0.00 49.90 2 stress 11:12:55 AM 0 8257 49.90 0.00 0.00 49.90 3 stress 11:12:55 AM 0 8258 49.90 0.00 0.00 49.90 1 stress 11:12:55 AM 0 8259 49.90 0.00 0.00 49.90 3 stress 11:12:55 AM 0 8260 49.90 0.00 0.00 49.90 0 stress 11:12:55 AM 0 8261 50.10 0.00 0.00 50.10 1 stress 11:12:55 AM 0 8262 49.70 0.00 0.00 49.70 2 stress Average: UID PID %usr %system %guest %CPU CPU Command Average: 0 8255 49.90 0.00 0.00 49.90 - stress Average: 0 8256 49.90 0.00 0.00 49.90 - stress Average: 0 8257 49.90 0.00 0.00 49.90 - stress Average: 0 8258 49.90 0.00 0.00 49.90 - stress Average: 0 8259 49.90 0.00 0.00 49.90 - stress Average: 0 8260 49.90 0.00 0.00 49.90 - stress Average: 0 8261 50.10 0.00 0.00 50.10 - stress Average: 0 8262 49.70 0.00 0.00 49.70 - stress
会发现 pidstat输出中没有%wait的问题,是因为CentOS默认的sysstat稍微有点老,源码或者RPM升级到11.5.5版本以后就可以看到了。而Ubuntu的包一般都比较新,没有这个问题。
*源码安装sysstat *
1
2
3
4
5
6
7
8
git clone --depth=50 --branch=master https://github.com/sysstat/sysstat.git sysstat/sysstat cd sysstat/sysstat git checkout -qf 6886152fb3af82376318c35eda416c3ce611121d export TRAVIS_COMPILER=gcc export CC=gcc export CC_FOR_BUILD=gcc ./configure --disable-nls --prefix=/usr/local/ make &&make install
再次查看
1
2
3
4
5
6
7
8
9
10
11
12
13
14
15
16
17
18
19
20
21
22
23
24
25
26
27
28
29
30
31
32
33
Average: UID PID %usr %system %guest %wait %CPU CPU Command Average: 0 16802 12.38 0.00 0.00 86.83 12.38 - stress Average: 0 16803 12.57 0.00 0.00 87.43 12.57 - stress Average: 0 16804 12.57 0.00 0.00 87.82 12.57 - stress Average: 0 16805 12.38 0.00 0.00 87.82 12.38 - stress Average: 0 16806 12.38 0.00 0.00 87.23 12.38 - stress Average: 0 16807 12.38 0.00 0.00 87.23 12.38 - stress Average: 0 16808 12.38 0.00 0.00 87.23 12.38 - stress Average: 0 16809 12.38 0.00 0.00 87.82 12.38 - stress Average: 0 16810 12.38 0.00 0.00 87.82 12.38 - stress Average: 0 16811 12.38 0.00 0.00 87.43 12.38 - stress Average: 0 16812 12.38 0.00 0.00 87.43 12.38 - stress Average: 0 16813 12.38 0.00 0.00 87.43 12.38 - stress Average: 0 16814 12.57 0.00 0.00 87.62 12.57 - stress Average: 0 16815 12.38 0.00 0.00 87.82 12.38 - stress Average: 0 16816 12.57 0.00 0.00 87.03 12.57 - stress Average: 0 16817 12.38 0.00 0.00 87.23 12.38 - stress Average: 0 16818 12.57 0.00 0.00 87.23 12.57 - stress Average: 0 16819 12.57 0.00 0.00 87.82 12.57 - stress Average: 0 16820 12.57 0.00 0.00 87.23 12.57 - stress Average: 0 16821 12.57 0.00 0.00 87.62 12.57 - stress Average: 0 16822 12.38 0.00 0.00 87.43 12.38 - stress Average: 0 16823 12.57 0.00 0.00 87.62 12.57 - stress Average: 0 16824 12.38 0.00 0.00 87.43 12.38 - stress Average: 0 16825 12.57 0.00 0.00 87.03 12.57 - stress Average: 0 16826 12.57 0.00 0.00 87.23 12.57 - stress Average: 0 16827 12.38 0.00 0.00 87.43 12.38 - stress Average: 0 16828 12.57 0.00 0.00 87.23 12.57 - stress Average: 0 16829 12.57 0.00 0.00 87.43 12.57 - stress Average: 0 16830 12.57 0.00 0.00 87.82 12.57 - stress Average: 0 16831 12.57 0.00 0.00 87.23 12.57 - stress Average: 0 16832 12.57 0.00 0.00 87.23 12.57 - stress Average: 0 16833 12.38 0.00 0.00 87.82 12.38 - stress
可以看出,8 个进程在争抢 2 个 CPU,每个进程等待 CPU 的时间(也就是代码块中的 %wait 列)高达 87.82%。这些超出 CPU 计算能力的进程,最终导致 CPU 过载。
本文为极客时间 《Linux性能优化实战》笔记
如果你也想学习 Linux 性能优化,可以扫描下方图片二维码报名