使用hping3 发送小包分析软中断导致的系统CPU使用率高问题
准备工具 2台机器
A 机器192.168.10.55 安装: docker sysstat sar tcpdump
B 机器 安装 hping3
在A机器执行以下命令,运行nginx
1 docker run -itd --name=nginx -p 80:80 nginx
在B 机器执行
1
2
3
4
5
6
7
8
9
10
11
12
13
14
15
16
17
18
19
20
21
22
23
24
25
26
# curl http://192.168.10.55 <!DOCTYPE html> <html> <head> <title>Welcome to nginx!</title> <style> body { width: 35em; margin: 0 auto; font-family: Tahoma, Verdana, Arial, sans-serif; } </style> </head> <body> <h1>Welcome to nginx!</h1> <p>If you see this page, the nginx web server is successfully installed and working. Further configuration is required.</p> <p>For online documentation and support please refer to <a href="http://nginx.org/">nginx.org</a>.<br/> Commercial support is available at <a href="http://nginx.com/">nginx.com</a>.</p> <p><em>Thank you for using nginx.</em></p> </body> </html>
在B机器继续执行以下命令 模拟 SYN FLOOD 攻击。
1 # hping3 -S -p 80 -i u100 192.168.10.55
参数说明
-S 表示设置 TCP 协议的 SYN
-p 表示目标端口为80
-i u100 表示每隔 100 微妙发送一个网络帧
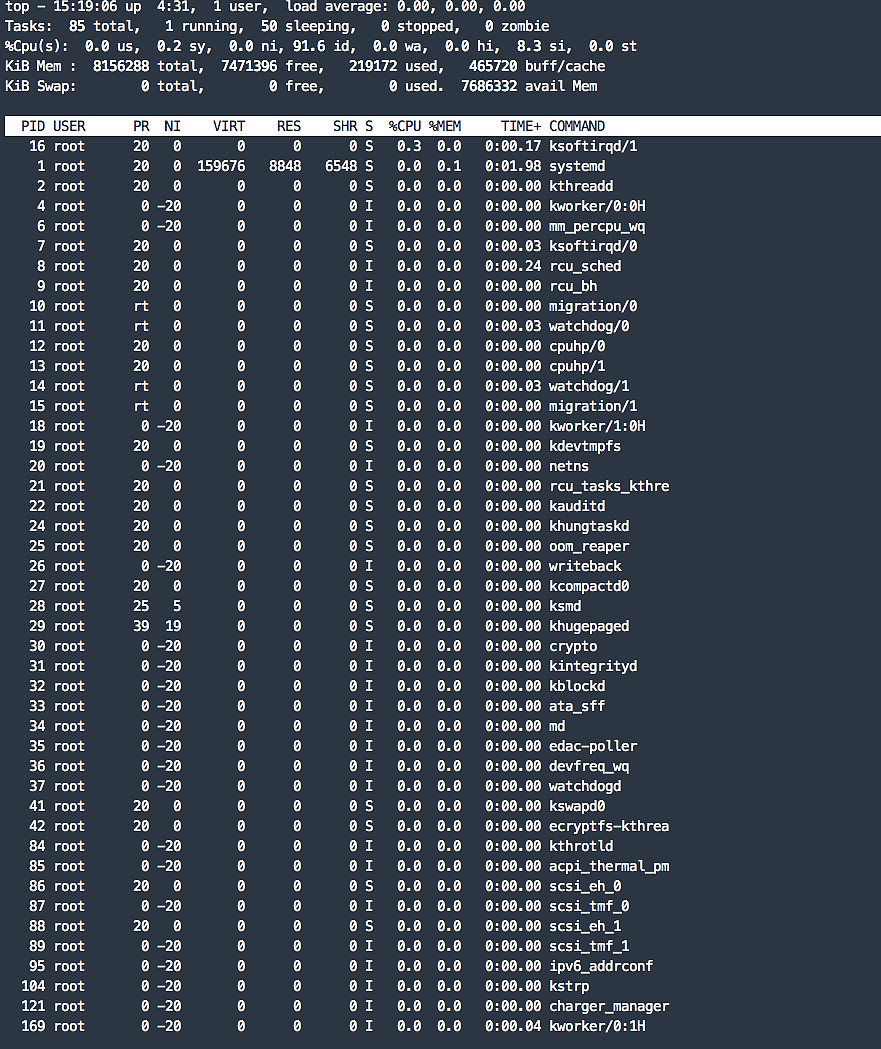
在 A 机器执行top 观察
平均负载全是 0,就绪队列里面只有一个进程(1 running)。
每个 CPU 的使用率都挺低,最高的 CPU1 的使用率也只有 4.4%,并不算高。
再看进程列表CPU 使用率最高的进程也只有 0.3%,还是不高呀。
查看 /proc/softirqs 1 watch -d "/bin/cat /proc/softirqs | /usr/bin/awk 'NR == 1{printf \"%-15s %-15s %-15s %-15s %-15s\n\",\" \",\$1,\$2,\$3,\$4}; NR > 1{printf \"%-15s %-15s %-15s %-15s %-15s\n\",\$1,\$2,\$3,\$4,\$5}'"
得到结果
1
2
3
4
5
6
7
8
9
10
11
12
13
Every 2.0s: /bin/cat /proc/softirqs | /usr/bin/awk 'NR == 1{printf "%-15s %-15s %-15s %-15s %-15s\n"," ",$1,$2,$3,$4}; NR > 1{printf "%-15s %-15s %-15s %-15s %-15s\n",$1,$2,$3,$4,$5}' linux: Wed Mar 27 15:36:34 2019 CPU0 CPU1 CPU2 CPU3 HI: 0 0 0 0 TIMER: 146284 312590 0 0 NET_TX: 7 1 0 0 NET_RX: 34 25056951 0 0 BLOCK: 0 0 0 0 IRQ_POLL: 0 0 0 0 TASKLET: 11 13 0 0 SCHED: 140342 306034 0 0 HRTIMER: 0 0 0 0 RCU: 152008 271203 0 0
通过 /proc/softirqs 文件内容的变化情况,你可以发现, TIMER(定时中断)、NET_RX(网络接收)、SCHED(内核调度)、RCU(RCU 锁)等这几个软中断都在不停变化。其中 NET_RX CPU1 上的变化最快。说明可能和网络收发数据包有关系,我们继续分析。
使用 sar 分析 1 2 3 4 5 6 7 8 9 10 11 12 13 14 15 16 17 18 19 20 root@linux:~# sar -n DEV 1 # -n DEV 表示显示网络收发的报告,间隔 1秒输出一组数据 Linux 4.15.0-46-generic (linux) 03/27/2019 _x86_64_ (2 CPU) 03:23:52 PM IFACE rxpck/s txpck/s rxkB/s txkB/s rxcmp/s txcmp/s rxmcst/s %ifutil 03:23:53 PM veth17e8b9b 12408.00 24817.00 702.80 1308.71 0.00 0.00 0.00 0.11 03:23:53 PM docker0 12407.00 24816.00 533.11 1308.66 0.00 0.00 0.00 0.00 03:23:53 PM lo 0.00 0.00 0.00 0.00 0.00 0.00 0.00 0.00 03:23:53 PM eth0 24824.00 12415.00 1309.17 703.60 0.00 0.00 0.00 0.00 03:23:53 PM IFACE rxpck/s txpck/s rxkB/s txkB/s rxcmp/s txcmp/s rxmcst/s %ifutil 03:23:54 PM veth17e8b9b 12234.00 24467.00 692.94 1290.25 0.00 0.00 0.00 0.11 03:23:54 PM docker0 12234.00 24467.00 525.68 1290.25 0.00 0.00 0.00 0.00 03:23:54 PM lo 0.00 0.00 0.00 0.00 0.00 0.00 0.00 0.00 03:23:54 PM eth0 24509.00 12348.00 1292.95 705.29 0.00 0.00 0.00 0.00 03:23:54 PM IFACE rxpck/s txpck/s rxkB/s txkB/s rxcmp/s txcmp/s rxmcst/s %ifutil 03:23:55 PM veth17e8b9b 12120.00 24238.00 686.48 1278.18 0.00 0.00 0.00 0.10 03:23:55 PM docker0 12120.00 24239.00 520.78 1278.23 0.00 0.00 0.00 0.00 03:23:55 PM lo 0.00 0.00 0.00 0.00 0.00 0.00 0.00 0.00 03:23:55 PM eth0 24251.00 12131.00 1279.00 688.57 0.00 0.00 0.00 0.00
对于sar的输出界面,我先来简单介绍一下,从左往右依次是:
第一列:表示报告的时间。
第二列:IFACE表示网卡。
第三、四列: rxpck/s和txpck/s分别表示每秒接收、发送的网络帧数,也就是PPS。
第五、六列: rxkB/s和txkB/s分别表示每秒接收、发送的千字节数,也就是BPS。
后面的其他参数基本接近0,显然跟今天的问题没有直接关系,你可以先忽略掉。
我们看 eth0 美妙接收网络帧数较大,达到了24251 而发送的网络帧则比较小 ,每秒接收的千字节数只有1279,而发送的只有688.57
我们通过公式计算下
说明平均每个网络帧只有 54 字节。这显然是很小的网络帧。也就是常说的小包问题
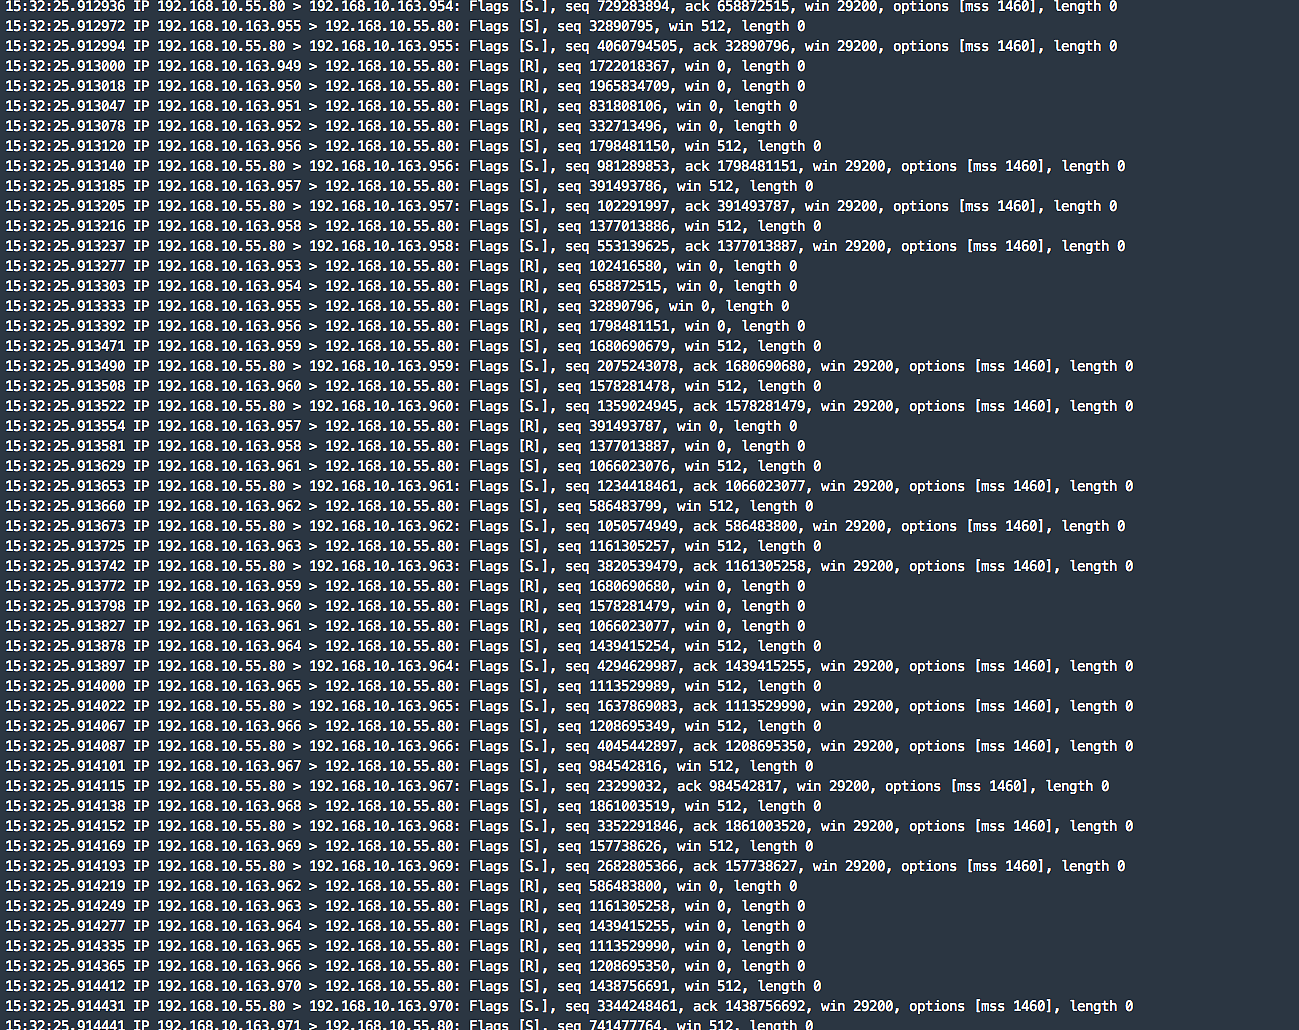
通过 tcpdump 抓包分析 1 # tcpdump -i eth0 -n tcp port 80
我们可以看到 源 IP 192.168.10.163 的996 端口向主机 192.168.10.55 80端口发送SYN。
喜欢新事物,关注云计算行业,对新的技术有追求,喜欢写作和coding